


Linda Navarette June 23, 2020
Imagine you’re writing a service responsible for processing messages from a variety of publishers. Depending on the content of the message, your service may take a variety of actions. A few questions will likely cross your mind:
-
How many messages can we expect to receive over time? Is that traffic fairly consistent or spiky in nature?
-
What is the average size of the messages we receive?
-
How often do the messages invoke this one complex action we would like to simplify or even remove altogether?
As a platform reaches maturity, the insight gained from platform-wide usage and performance metrics becomes invaluable. However, building out a horizontal metrics service can be a large effort. You need to determine the amount of data the platform is expected to generate, which metrics provide valuable insight, the cardinality of those metrics, the queries and aggregations you will want to perform against that data. So what do you do in the early stages of development when you want to quickly get started tracking metrics for your service as a way to inform and validate product direction? AWS CloudWatch Metrics provides support not only for free out of the box metrics around your resources but also for publishing and storing custom metrics. There are two ways of creating custom metrics: by creating a metric filter on your application logs or by publishing metrics directly via the CloudWatch API. As I describe each approach I’ll include the resources I created in CloudFormation, you can see the full template with both approaches here.
Metric Filters
Metric filters enable you to filter and parse your log messages to then transform them into metrics. I set up a Lambda Function which takes in a list of messages and logs their length and contents in a predictable format:
WriteMetricToLogs:
 Type: AWS::Lambda::Function
 Properties:
   Code:
     ZipFile: |
       import json
       def handler(event, context):
           for msg in event:
               print('metric.content_length {0} content: {1}'.format(len(msg), msg))
   Handler: "index.handler"
   Role: !GetAtt Role.Arn
   Runtime: python3.7
Knowing this log format, I’m able to then create the metric filter to publish that content length as a custom metric:
ContentLengthFilter:
 Type: AWS::Logs::MetricFilter
 Properties:
   LogGroupName: !Ref LogGroup
   FilterPattern: '[metric_name="metric.content_length", value, content]'
   MetricTransformations:
     - MetricValue: "$value"
       MetricNamespace: "CustomMetricDemo/MetricFilter"
       MetricName: "ContentLength"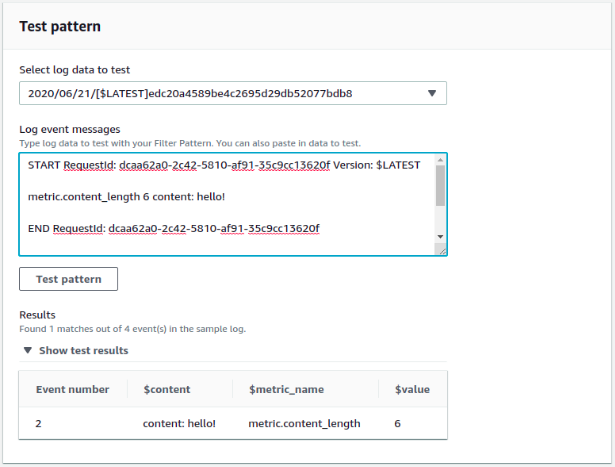
When you’re first getting started with metric filters, it’s easiest to visualize what that filter pattern does by creating it in the CloudWatch console. Here you’ll see only my log messages with start with “metric.content_length” are selected, and the next token (space-delimited) is used for the value.
Publishing Metrics
This approach is done purely in code using one of the SDKs AWS provides for publishing custom metrics. This API allows more configuration options for your metrics (dimensions, statistic sets, units) but for the sake of comparison I created a Lambda Function which takes exactly the same inputs as above and publishes the same metrics.
Type: AWS::Lambda::Function
Properties:
 Code:
   ZipFile: |
     import boto3
     import json
     from datetime import datetime

     cw = boto3.client('cloudwatch')

     def handler(event, context):
         for msg in event:
             print(msg)
             cw.put_metric_data(
                 Namespace='CustomMetricDemo/PutMetricData',
                 MetricData=[
                     {
                         'MetricName': 'ContentLength',
                         'Timestamp': datetime.now(),
                         'Value': len(msg)
                     }
                 ]
             )
 Handler: "index.handler"
 Role: !GetAtt Role.Arn
 Runtime: python3.7
Here you’ll see the same information is published via the SDK which I defined in the metric transformation in the example above.
Comparison
Chances are you are already writing predictable logs in the situations you care to track but have been examining those logs by searching them rather than by extracting them out to metrics. I’d recommend starting with metric filters and gaining some of the benefits of metrics with minimal effort. Over time you may come across situations where you need to publish a more complex metric that is worth making the extra API call at runtime.