


Jedediah Ecker January 25, 2023
Most developers are already familiar with the debugging tools in their favorite IDE, but they may not be aware of how powerful and time-saving it can be to have a dedicated web traffic debugging tool.
Traditional tools like WireShark, and the underlying utility tcpdump, can provide powerful insight into network traffic, but they also have certain limitations. Sometimes you need to read encrypted SSL/TLS traffic without having access to a server’s private certificate, or you want to modify live traffic. These tasks can’t be accomplished with a simple packet sniffer.
Capture proxies let you read encrypted traffic between apps and services. If you are troubleshooting a mobile app or a service you develop, you can always add more logging, but with a capture proxy you can analyze traffic without waiting for deployments or client updates. If the app or service you’re trying to troubleshoot is owned by a third-party, this may even be the only network traffic debugging technique available to you.
To give a specific example, I used to work on middleware that allowed smartphones, tablets, and PDAs to sync data with mail servers that they otherwise couldn’t. This software could be purchased and installed inside of a customer’s network, giving them complete control over their data. Unfortunately, this made it difficult to troubleshoot synchronization issues.
One day, a customer called our support center because one of their users was having an issue with a specific Android phone model. Whenever they attempted to login from their mail app, they got a vague error message displayed. It wasn’t related to a login failure, and no one in support had ever seen it.
A support rep reproduced the issue against the customer’s server with the same phone model, but we didn’t have easy visibility into what was happening. There were no logs we could access on the device, and the customer couldn’t find any logging on their end. I asked the rep to see the phone, and configured it to run through a capture proxy on my developer system.
What did I see? Well, the mail APIs we were supporting used WBXML payloads, but when the user tried to login, they actually got an HTML page back as a response! It contained a message saying “this device has been blocked by your corporate IT policies”. It turned out that someone in the customer’s IT department had set up a global HTTP UserAgent filter. This filter blocked things before the phone even reached our software.
The customer who was working with our support rep didn’t know this filter was in place, and I got to explain the benefits of a capture proxy to him, and our support rep. I solved an issue they were stuck on for some time, in roughly 5 minutes. I honestly have no idea how else we could have solved it.
These tools have many other practical uses. To name a few:
- Debugging CORS issues
- Borrowing credentials from a mobile app to explore APIs with a tool like Postman
- Hardening security through fuzzing
- Reverse engineering
- Modifying API calls without code changes, to troubleshoot without a build or deployment wait
How does a capture proxy work?
A regular non-capture proxy, for the most part, just routes traffic directly without interfering.
A debugging/capture proxy works by acting as a Man in the Middle (MITM). This means that outgoing traffic is routed through the proxy, the proxy acts as a gateway, and then it replays the traffic to the intended server.

If you’re wondering what stops a bad actor from doing this to you, it’s the SSL/TLS certificate trust chain. You may have seen security warnings in your browser when visiting certain sites. These often show up when a site has an invalid SSL certificate. Certificates are used to both provide encryption to end users, and to verify the identity of the website you are interacting with. If you ever see certificate errors, you should assume your connection to a website is insecure and you need to take a step back and investigate what is causing these warnings. You could avoid interacting with it entirely, and should certainly never enter personal information or passwords. Even loading a site like this could potentially be dangerous.
How is a capture proxy able to listen to encrypted traffic not-intended for it, in the first place? The answer is, that it must issue its own certificates for the sites the application is trying to visit.
Not just anyone can issue certificates for, say… www.google.com. That’s where “Certificate Authorities” (CAs) come in. Whether it’s your phone, your PS5, or your work laptop; any device you’re using comes pre-loaded with a well-known list of CAs it trusts to issue certificates. In order to get your application to trust your capture proxy, you must configure it to trust the CA that your proxy is using to issue certificates.
Capture proxies typically generate a CA certificate at install time, so that everyone using the same capture proxy tool won’t be vulnerable to certs issued by some default, global CA.
What else can you do with a capture proxy?
Capture proxies have many features. Simply using them to read encrypted traffic is only the beginning. We’ll use three different popular tools (Charles, ZAP, and mitmproxy), each with a different core focus, to demonstrate how useful these can be in different situations.
Charles Web Debugging Proxy
Charles is a paid tool designed primarily to help developers troubleshoot their work, and its feature focus really shows that. We’ll list some of the most useful below.
View, Edit, and Replay Encrypted Traffic
You can easily view traffic that is either organized by its URL structure, or as a “Sequence” to see it in order.
If you see unreadable data in the body field, you may need to right-click on the endpoint you want to view, check “Enable SSL Proxy”, and then repeat your steps.
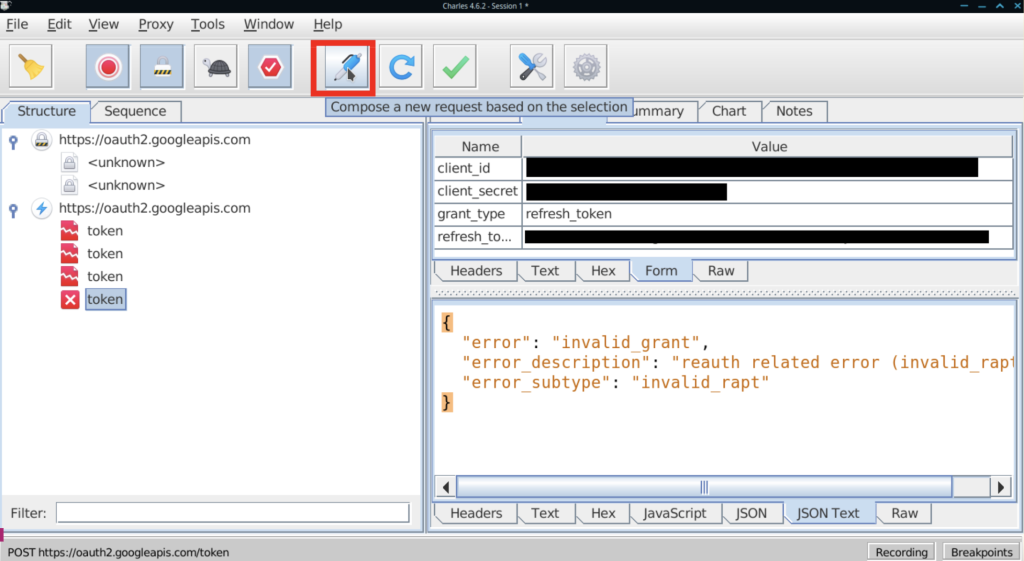
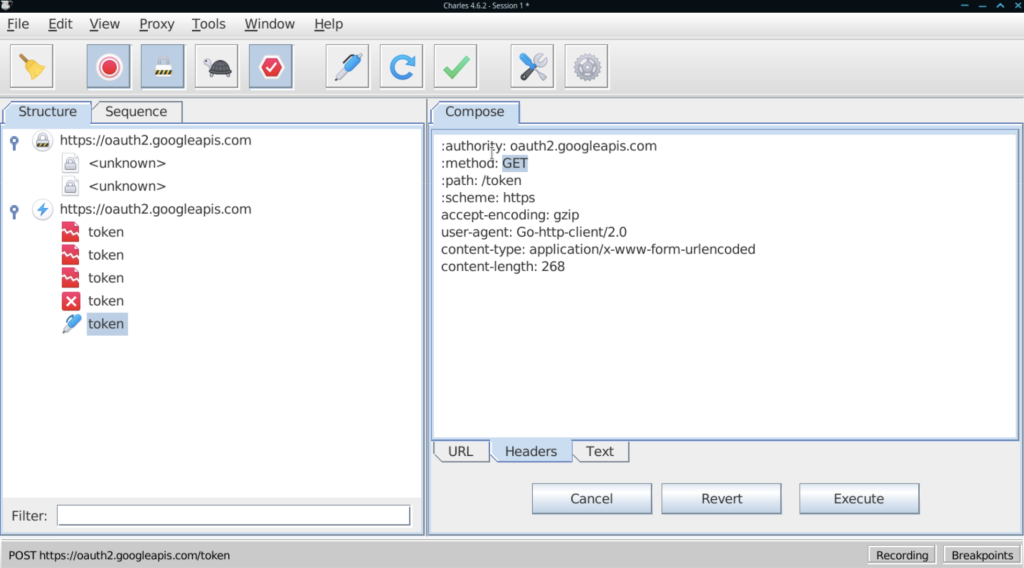
If you select a request, and hit the Pen icon, you’ll be able to edit a copy of the original request, replay that, and see what response you get.
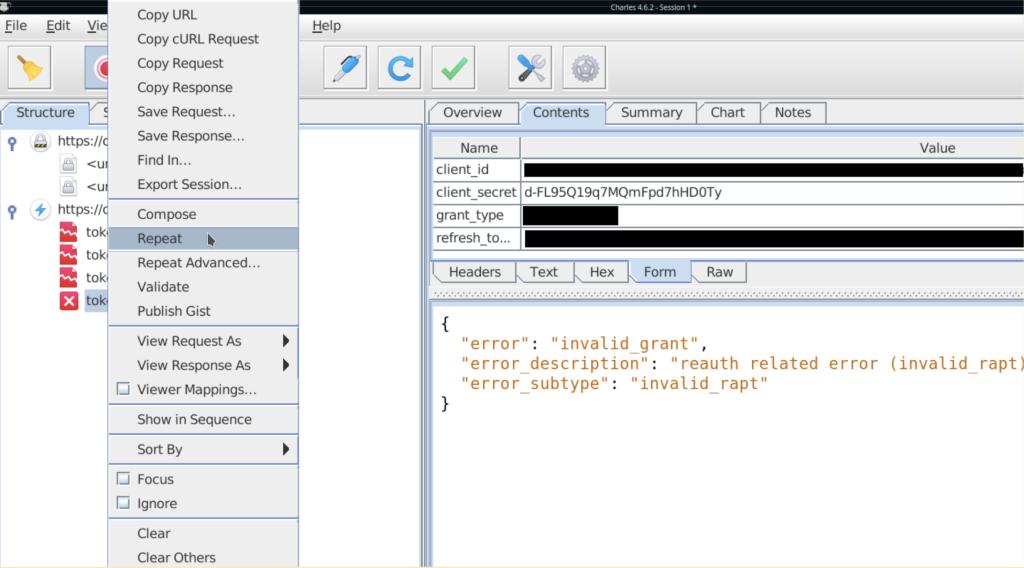
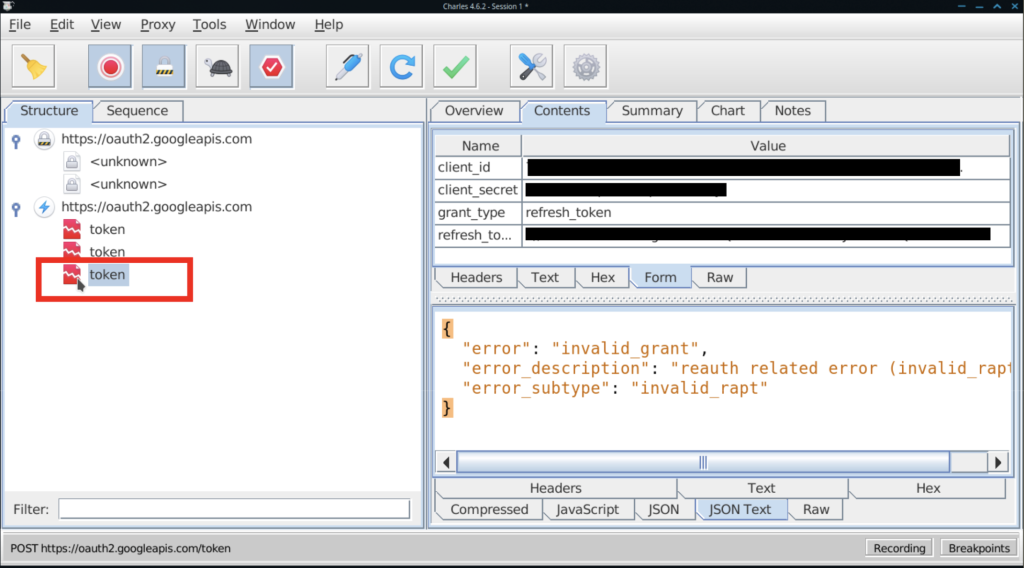
You can also right-click a request and choose “repeat” to replay it. This can be pretty handy if you’re tweaking a local web app and want to verify a fast change, and if you choose “Repeat Advanced”, you can repeat the request as many times as you wish, with as many threads as you wish, which can be useful for a very quick-and-dirty load test.
Web Breakpoints
Web breakpoints allow you to alter a request before it’s sent, and to alter a response before it’s returned.
Setting a breakpoint in Charles is as simple as right clicking a request you’ve already recorded, toggling “breakpoints”, and causing the request to be repeated.
When the application next makes the request, you are prompted to edit it before letting it go out.
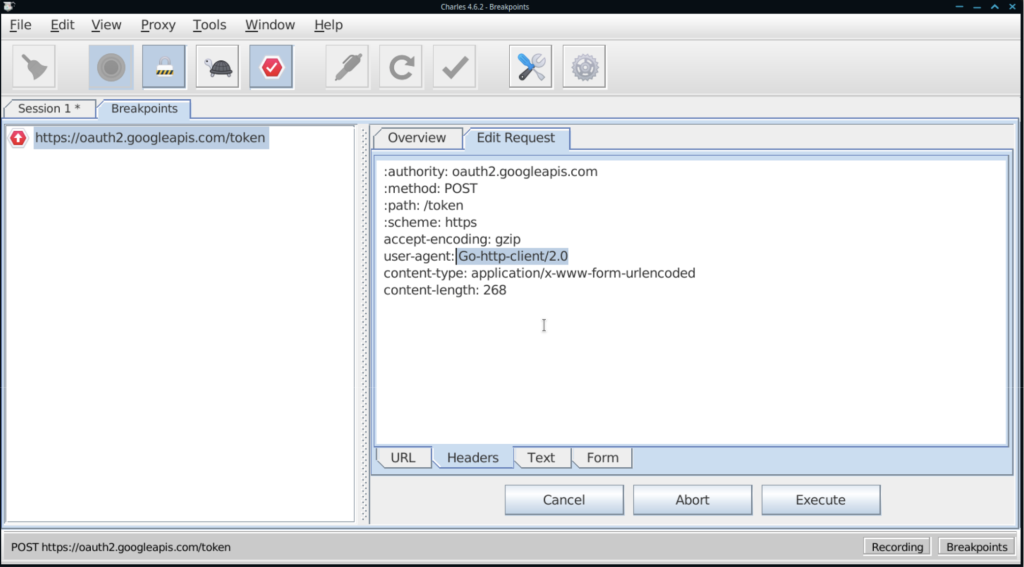
After you Execute the request, you also get a chance to edit the response before you send it back to the caller.
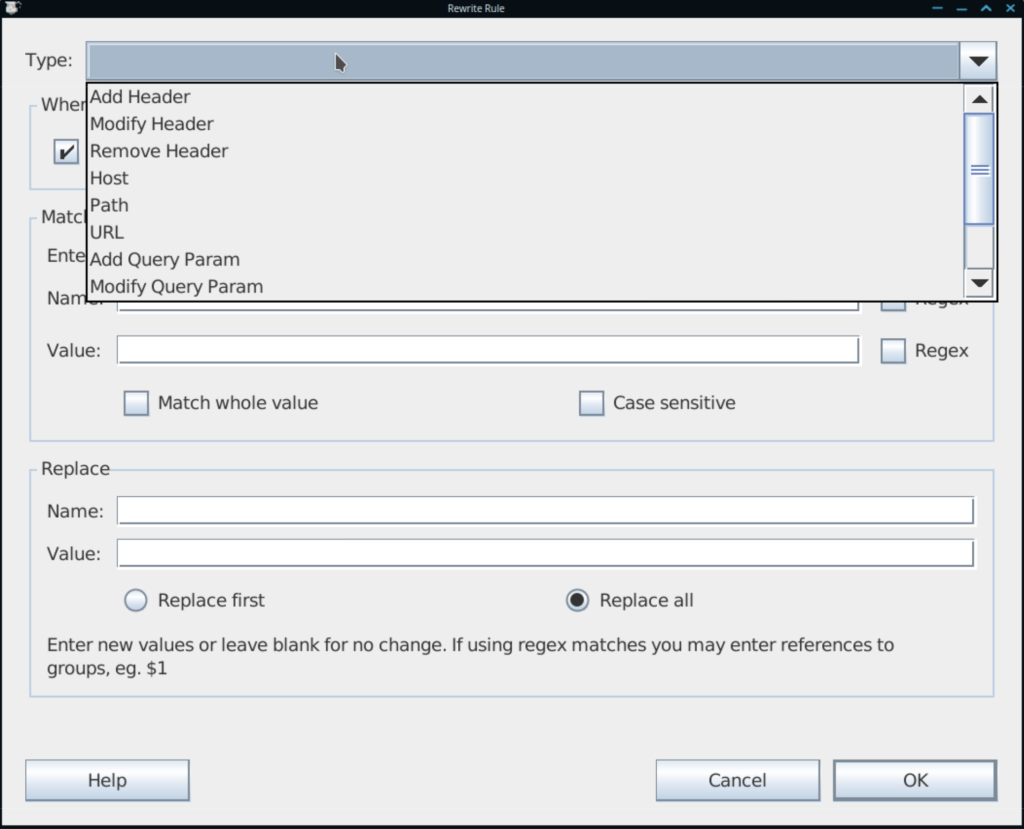
Traffic Rewrite Rules
If this process is too slow with client timeouts, or you’re just trying to run a behavior experiment without changing too much code, you can try the Rewrite Rules feature. This allows you to create match “Location” patterns, and assign traffic modifications.
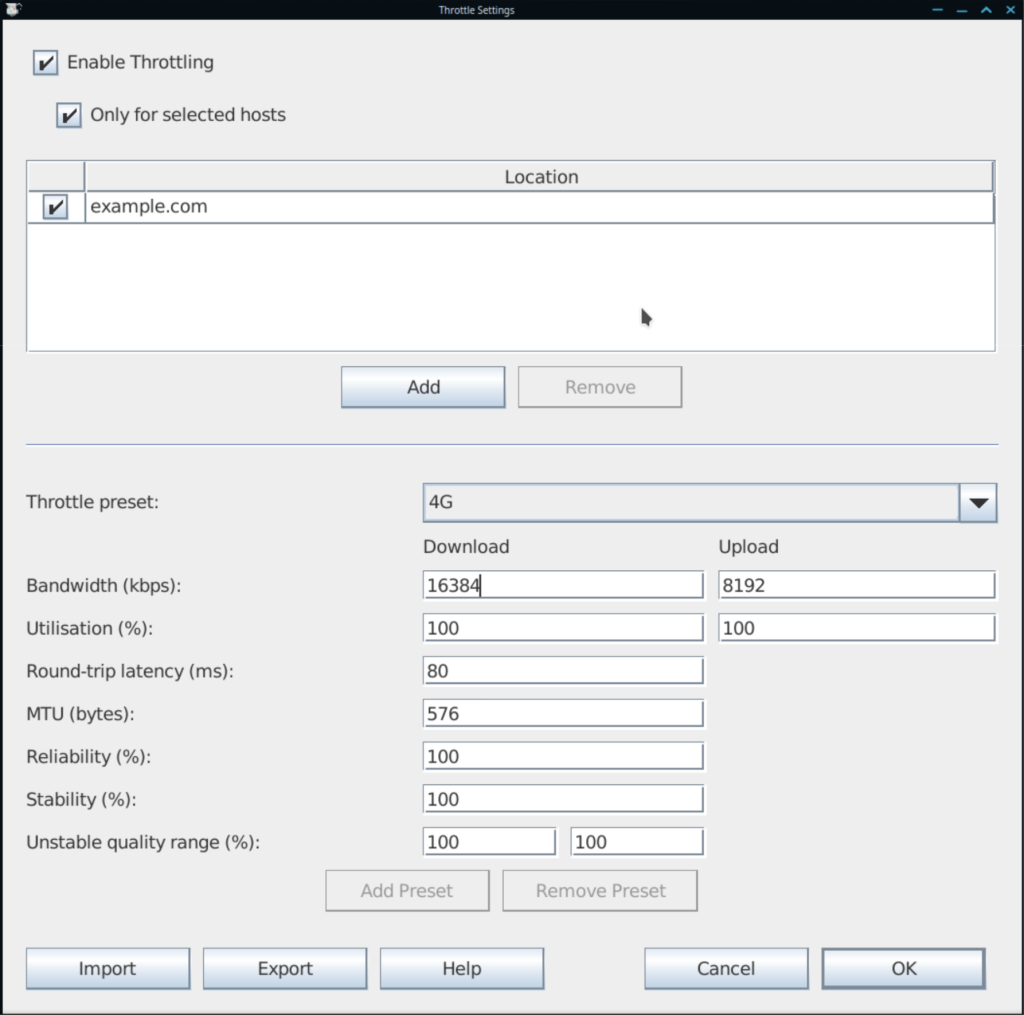
Throttling
Are you having a difficult time reproducing issues for users who have flaky internet connections, or who have really high connection pings? Charles can help you simulate those network conditions with throttling settings:
Zed Attack Proxy (ZAP)
ZAP, like Charles, is a capture proxy, and it shares many of the same features. Its interface is, however, optimized for a very different use case.
ZAP is an open source application designed to help security researchers and penetration testers explore and scan applications for vulnerabilities.
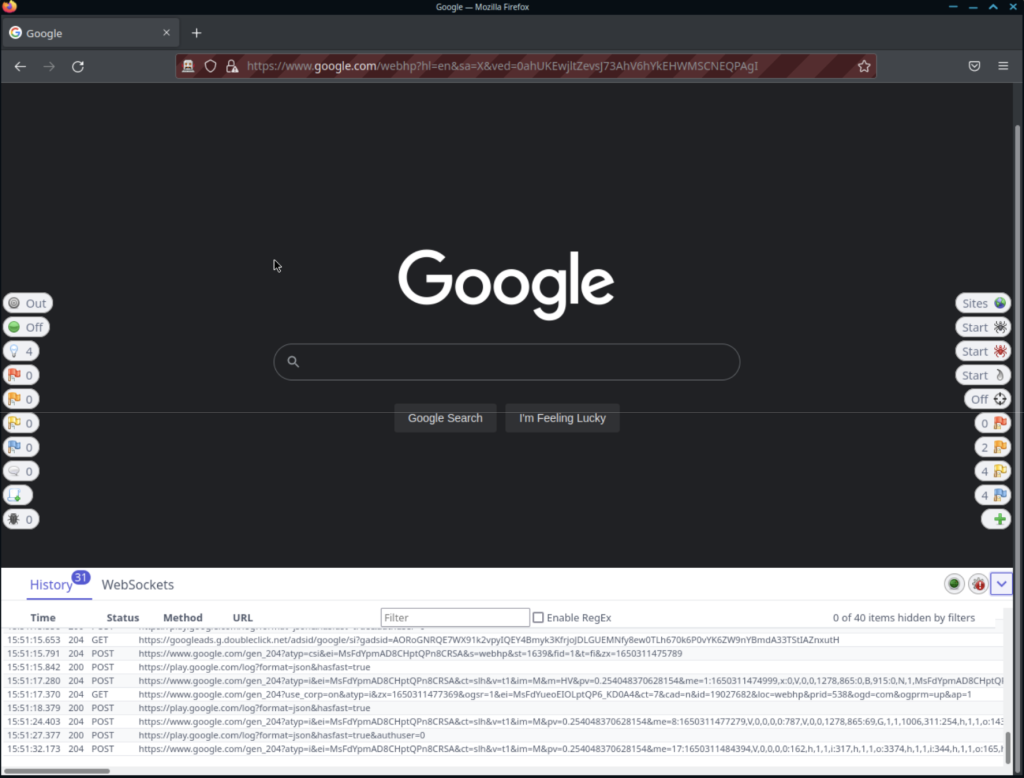
After you open ZAP, if you have a browser like Firefox installed, you’ll see a quick launch icon show when you open it.

After you open your browser this way, you’ll see an isolated browser session with none of your bookmarks, extensions, or cookies.
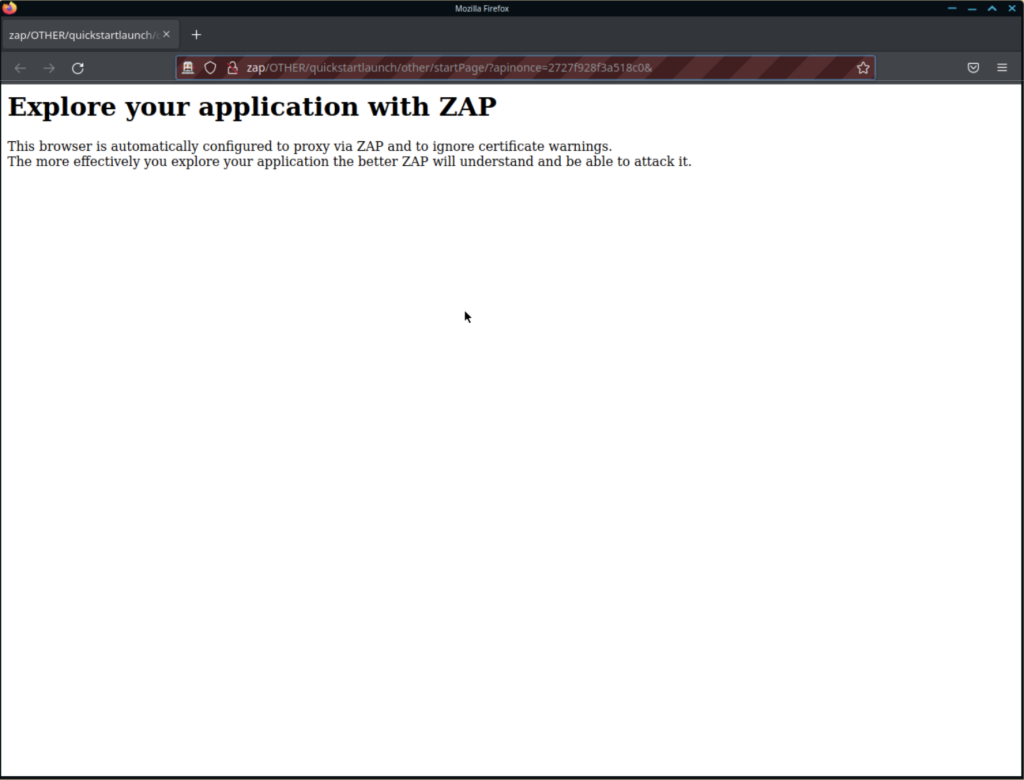
As soon as you navigate to any page, you’ll be prompted to take the “HUD Tutorial”. Take this before doing anything else with ZAP.
The ZAP HUD is an overlay of controls that you’ll see as you use the browser, that alert you to possible vulnerabilities, allow you to tinker with forms, and to generally explore a site.
While scanning your own applications for vulnerabilities is an excellent idea… As this is a penetration testing tool, it is intended to attack websites. You should NEVER use any of the attack features of ZAP against a site without getting permission from the site owner.
mitmproxy
Mitmproxy (man-in-the-middle proxy) is another fully open source option.
Written in python, mitmproxy can easily be installed with pip, and can be used in a headless environment with little effort, once a user figures out the UI.
It provides a web-based GUI, a terminal based GUI, and a scripting engine. If you just start with the web-based GUI, its core features may seem less impressive at a glance, but don’t be misled. Mitmproxy really shines in its powerful terminal based UI, and it can be extended with python scripts for more advanced features.
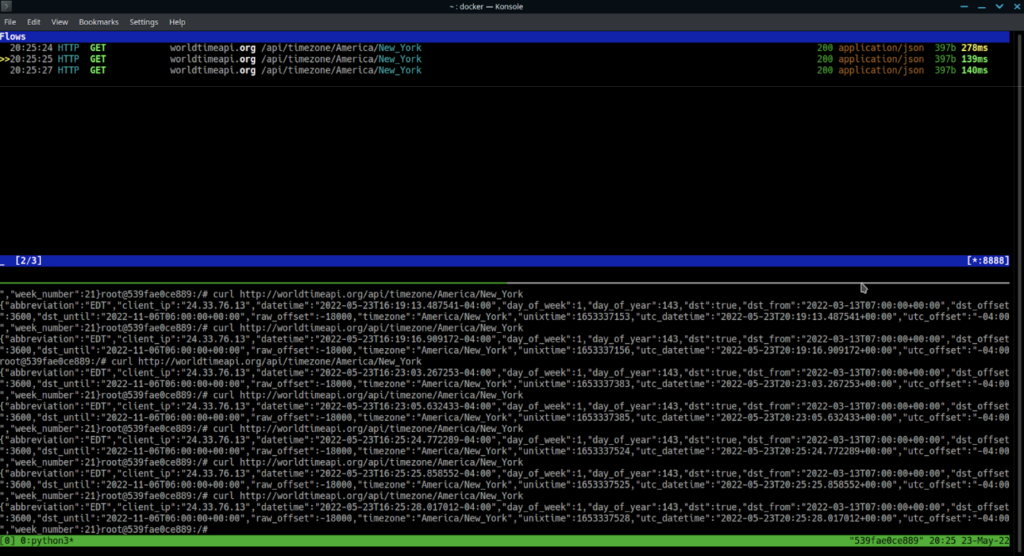
Mitmproxy has a higher learning curve than traditional GUI based tools, but it’s excellent in its own right.
Configuring a capture proxy
There are two steps to configuring an application to use a capture proxy.
- Tell it to use the proxy
- Tell it to trust the CA
While this may sound straightforward; setup can vary between languages, libraries, operating systems, and even web browsers. Fortunately, you can learn how to configure a capture proxy using mitmproxy in our follow-up tutorial.
Summary
A capture proxy is a very different tool than a packet capture utility. It has different pros and cons, and different use cases. Here’s a simple breakdown:
| Packet Capture (PCAP) Utilities | Capture Proxies | |
| Recording Method | This captures directly on network interfaces. | This captures network traffic by acting as a “man in the middle”, and recording, then replaying, the traffic an application sends. |
| Information Level | It is low-level and packet-accurate, making it well suited to troubleshoot packet-level issues. The focus on packet-level information can make it a little harder to read higher-level information like REST calls. | This is a higher-level interface and tends to focus more on what is transmitted (HTTP) than how it was transmitted (packet info). |
| Reading Encrypted Traffic | Requires the server’s actual SSL/TLS private key to read any encrypted traffic. Even if you have access to a private certificate’s key, transmitting it around is a security risk. | Does NOT require the server’s private key, but does require trust configuration and basic knowledge of Certificate Authorities. |
| Live Traffic Modification | This can’t really tinker with any traffic, it simply records the exact packets transmitted. | Allows many features, including: – Request edit/replay – Throttling – Rewrite rules – Breakpoints |
| Configuration | This has little to no configuration past installing the tool itself. | Configuring this can be involved. It can vary with operating systems, languages, and even specific libraries. |
Much like with a java, python, or JS debugger, a web debugger can greatly accelerate your application development time by providing visibility into web traffic, and a way to tinker with that traffic as it happens.
Capture proxies can be helpful for troubleshooting scripts in runtimes where you may have limited visibility of what’s happening under-the-hood, such as Terraform scripts. They can also be great for A/B comparisons between competing implementations of APIs, so you can get a better idea of why something you are trying isn’t working.
They can provide security scanning and penetration testing, as well as load testing, and real-world network condition simulations such as throttling.
While these can take more effort to configure and understand than typical debugging; the benefits to application quality, testing, and development speed, can pay for themselves very quickly.