

Effective Kubernetes monitoring using Prometheus
Effective Kubernetes monitoring using Prometheus
Joe Truncale
Joe Truncale October 8, 2019
The difficulties of building out a robust monitoring solution for Kubernetes have evolved past the decision of tooling and into that of effective implementation. Regardless of the underlying platform, we’ve all seen large projects suffer instability due to a lack of subject matter expertise. The goal of effective monitoring is not just to alert you when something catastrophic happens. Instead, it should warn the appropriate teams before issues arise and provide them with the appropriate context and corresponding remediation steps. In this post, we’ll explore how to design a monitoring solution that provides meaningful alerts with proper context, instead of the white noise we’re all used to.
Prometheus and its surrounding ecosystem have emerged as the standard for Kubernetes monitoring. The Prometheus Operator in particular has simplified the technical implementation by managing all of the components with one unified controller.
The components (Custom Resources) managed by the Prometheus Operator are as follows:
-
-
Scrapes ServiceMonitors, reads PrometheusRules, and forwards to AlertManager
-
-
Aggregates alerts from Prometheus and routes them to “Receivers” (ie. email, slack, etc..)
-
-
Definitions of metrics endpoints where Prometheus should scrape
-
-
Definitions of PromQL (Prometheus’s query language) and their corresponding thresholds that define an alert
-
-
-
-
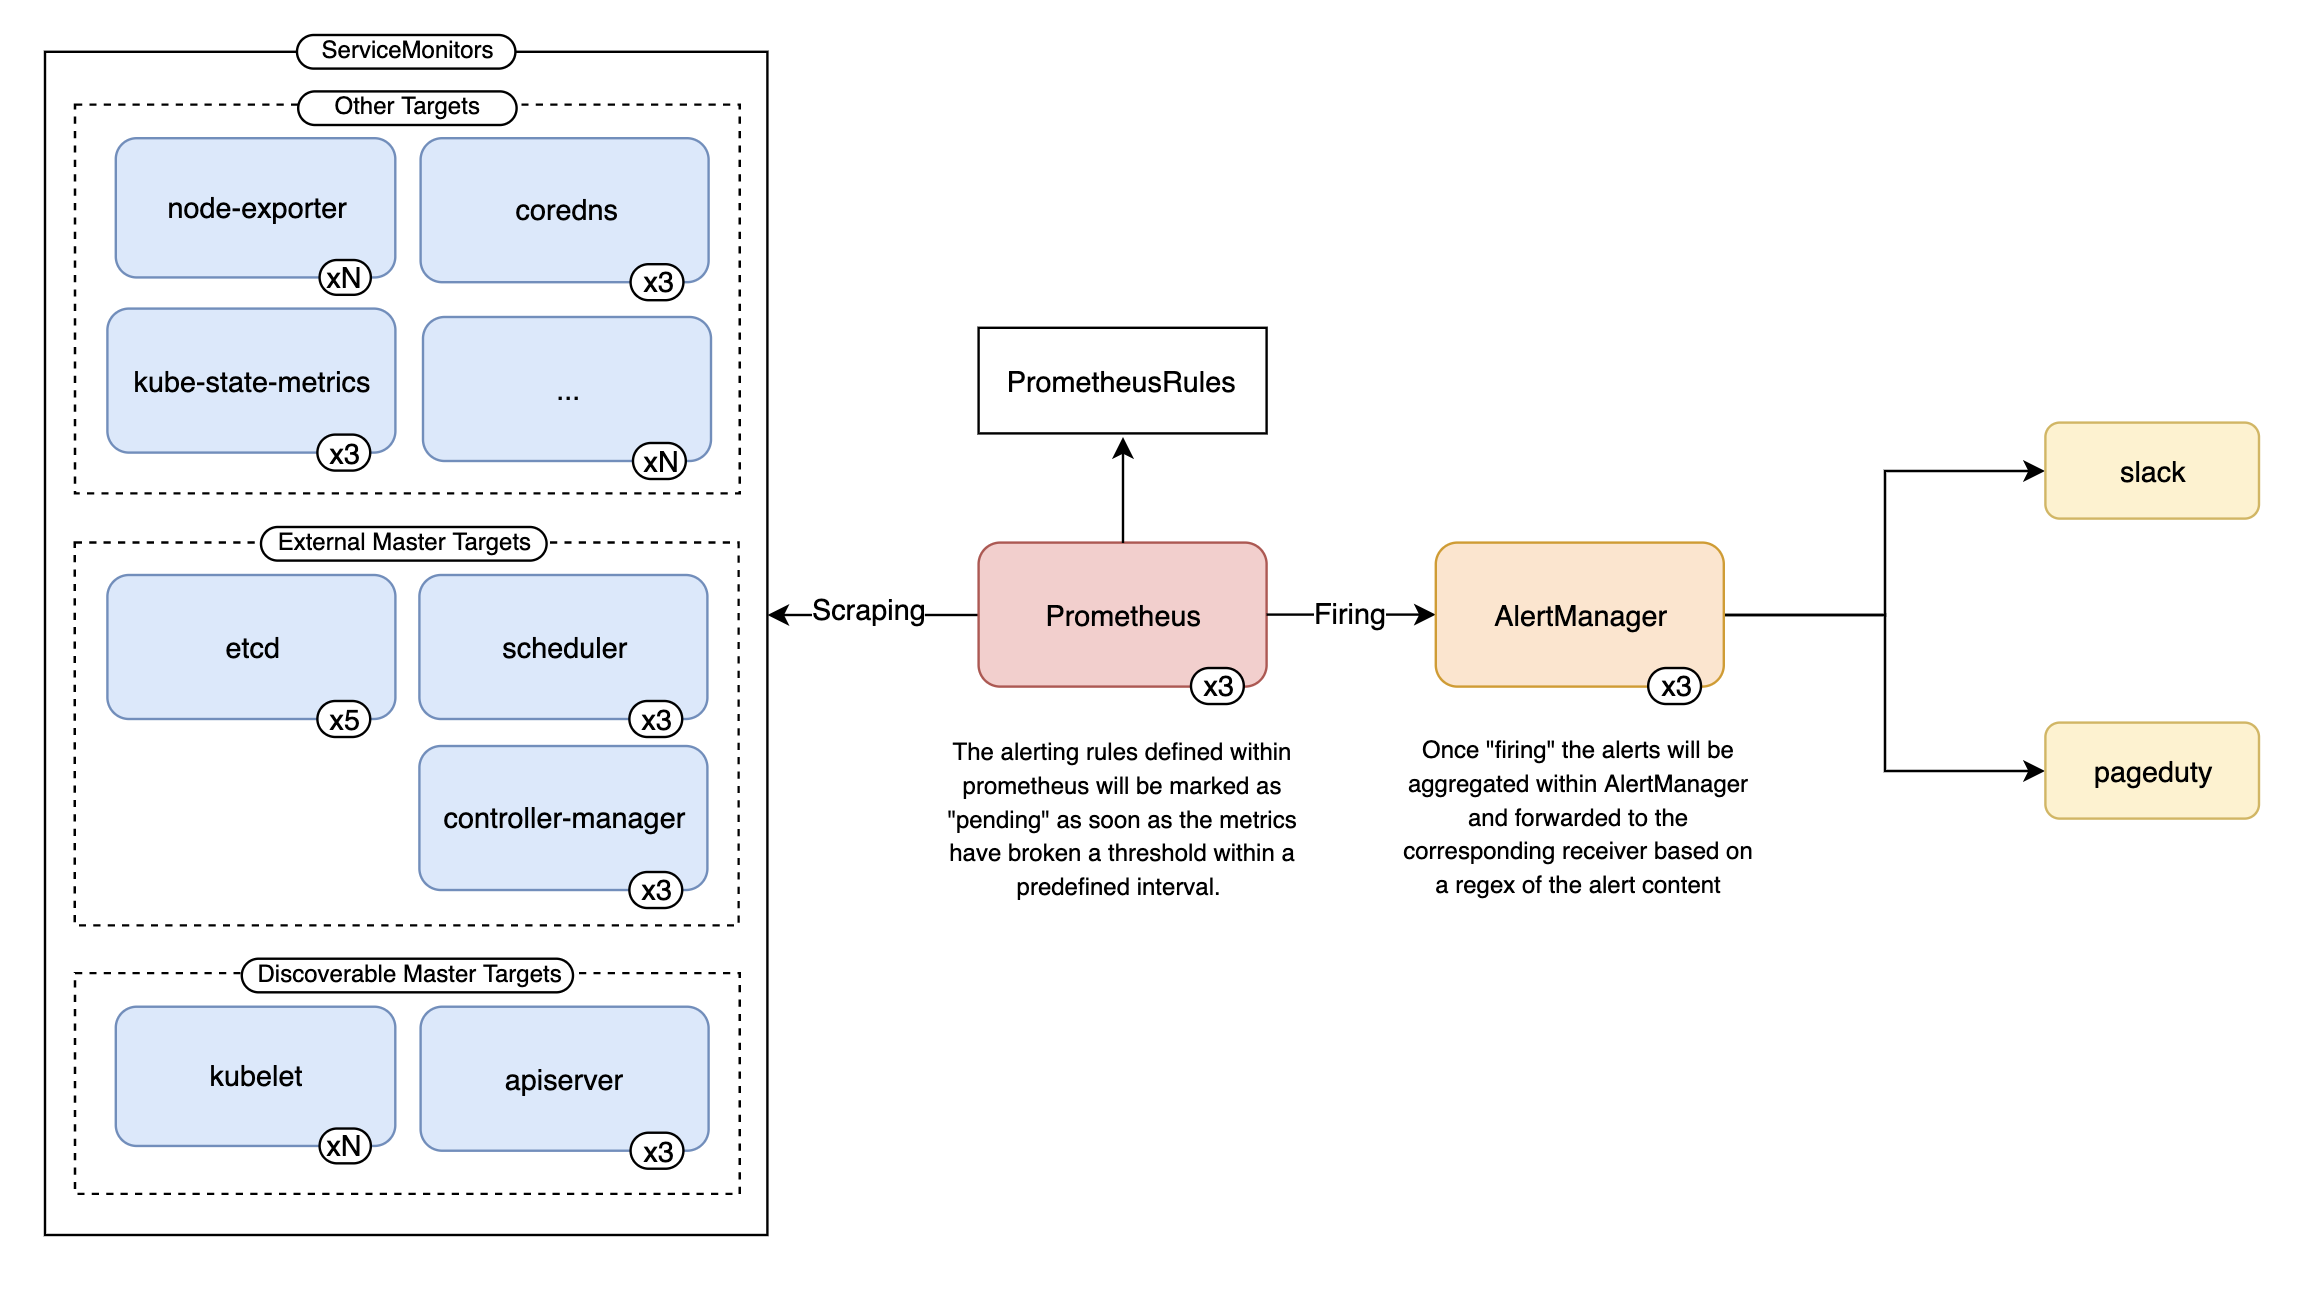
Figure 1. Example architecture of Prometheus-Operator alerting flow
The Prometheus Operator Helm chart goes one step further by bootstrapping all of the necessary components for Kubernetes monitoring along with a selection of common-sense alerting rules and Grafana dashboards.
These default rules and grafana dashboards come from another project called Kubernetes-Mixin. For companies that are just getting started with the Prometheus stack, this project provides an excellent starting point for understanding how to write your own Alerts/Graphs since both would require proficiency with PromQL. Additionally, these rules lay out some basic thresholds for what defines a healthy or unhealthy Kubernetes environment.
 - alert: etcdInsufficientMembersannotations:message: 'etcd cluster "
{{`{{ $labels.job }}`}}": insufficient members ({{`{{ $value
}}`}}).'expr: sum(up{job=~".*etcd.*"} == bool 1) by (job) <
((count(up{job=~".*etcd.*"}) by (job) + 1) / 2)for: 3mlabels:severity:
                                                                          critical
Figure 2. An etcd PrometheusRule that will alert when an etcd cluster has too few members to maintain quorum.
The rule above outlines an especially critical scenario. For instance, if there is a cluster of 5 etcd nodes, this would imply that less than 3 nodes are up. As soon as this expression evaluates true, Prometheus will mark this as “Pending”. Once three minutes pass, an alert will begin “Firing”.
Hold up…What is firing?
Firing means that the alert is now being sent from Prometheus to AlertManager. From there, AlertManager will aggregate any additional alerts that it can group by and send them out to the receivers you’ve defined. It will continue to “fire” on a predetermined interval set in the Prometheus config until it is resolved/silenced.
But now I have more questions!
-
Where should this alert be sent?
-
Which team should handle this?
-
.. and what should they do?
Before we can answer those questions, we need to understand the alert itself, the components affected and what troubleshooting would entail. This means going through many of the default “common-sense” alerts and figuring out how they would affect your cluster, as well as which teams would need to be involved. Only once you go through this exercise can you begin to write the runbooks needed to address many of these alerts. Though it’s a considerable upfront cost, it will minimize headaches down the road and allow you to delegate these “fires” to support teams instead of your team being inundated.
Each individual Prometheus alert can be customized to your organization’s needs. This means that the “critical” alerts get sent to an internal monitoring endpoint, as well as Slack and PagerDuty. While “warning” alerts can be sent directly to Slack without waking up anyone in the middle of the night. Additionally, those alerts can be routed to different slack channels depending on the team that you’ve designated to be responsible for resolving. All of this is controlled within the Receivers portion of the Prometheus configuration.
On top of this, you can provide the context needed to understand and repair your cluster. For instance, we can dynamically include links to the appropriate runbooks and even dashboards that show real-time information about the issue. Information on customizing alerts can be found within the Notification Templates documentation.

Figure 3. Enhanced Slack alerts using dynamic templating
Once you’ve got a sufficient understanding of the existing alerts, some experience with PromQL, and a robust alerting setup… you can begin to write your own alerts! No matter how much you customize default alerts, you’ll likely still need to design your own alerts for the granularity and specificity your organization requires. Now that this alerting framework is in place, you can start to share your knowledge and involve other groups in designing the rest of the alerts your company needs. If you’re looking for ideas on how to set up effective monitoring in AWS, check out Abe’s post on using CloudWatch with Terraform.