

Leveraging Synthetic Testing for Reliability and Performance on GCP
Leveraging Synthetic Testing for Reliability and Performance on GCP

Linda Navarette
Linda Navarette May 10, 2022
Imagine owning the APIs behind a music streaming site – there are many such products publicly available. If a potential user notices retrieving content takes 15 seconds from your API versus 250 milliseconds from a competitor, which do you think they’ll choose? Similarly, imagine a user onboarding receives several errors while attempting to use your product but not while using your competitor’s. Again, which product do you think they’ll choose to leverage?
Availability and performance are critical to your user experience but often overlooked in testing practices focused on functionality.
What is Synthetic Testing?
Synthetic testing, or synthetic monitoring, enables you to monitor your API’s functionality, availability, and performance by sending consistent and predictable requests to your API and expecting specific results. Various products help developers meet this need with low effort:
-
AWS CloudWatch Synthetics – backed by AWS Lambda, a serverless function is executed each time the test runs, allowing them to be highly bespoke or copied from a generic blueprint. In addition, AWS Cloudwatch provides alerts and specialized dashboards displaying performance, availability/uptime, and screenshots (if testing a UI).
-
Datadog Synthetic Monitoring – configuration-based, multi-step API or UI tests, enabling developers to reap the benefits of synthetic tests without needing to write any code. The tests are closely integrated with the Datadog platform, providing you with monitors, alerts, and dashboards displaying performance, availability/uptime, and screenshots (if testing a UI).
-
GCP Uptime Checks is a simple configuration-based, single-step API test that confirms an endpoint’s status code and (optionally) response body. Additionally, Google Cloud Monitoring provides a dashboard for viewing historical performance and availability/uptime.
I am working with a client on standardizing API practices across their organization while undergoing a migration to GCP, and monitoring is a core practice many teams would like to improve. To achieve this, I started using GCP Uptime Checks, but I was surprised to find it’s not easy to set up an uptime check if your API uses standard OAuth authentication.
Here’s the problem: when the auth token I use to configure my uptime check expires (in our case, 1 hour later), my uptime check starts failing with a 401 response from my API.
Creating Uptime Checks with Authentication on GCP
I found this approach of creating a cloud function as a proxy to obtain API authorization. If the organization was migrating from AWS CloudWatch Synthetics or teams were already in the habit of maintaining code for their synthetic tests, this would option would be great because it would support the same level of configuration teams expect. However, in our case, the practice of synthetic monitoring will be somewhat new, so this approach felt like too much to maintain. Additionally, my uptime check statistics wouldn’t reflect my actual API usage because they would also be exercising the proxy function.
Instead, what if I modify the uptime check each time it needs a new auth token? Suppose I could simply update the uptime check with a new authorization token as required. In that case, I could leverage Uptime Checks for my API monitoring without needing code or customization within the critical path of the test itself.
Let’s imagine our example music streaming site is Spotify. You can register for developer access to follow along. Our uptime check will be for the browse categories API.
First, I need an automated way of creating an uptime check. I know Terraform will allow me to easily configure and modify uptime checks with a google_monitoring_uptime check_config resource. For now, I’ll hardcode an access token I retrieved from the Spotify developer portal.
resource "google_monitoring_uptime_check_config" "http" {
 display_name = "spotify-uptime-check"
 timeout      = "10s"
 period       = "600s"

 http_check {
   path           = "/v1/browse/categories?limit=5"
   request_method = "GET"
   headers = {
     "authorization": "Bearer <INSERT YOUR TOKEN HERE>"
   }
   mask_headers = true
 }

 monitored_resource {
   type = "uptime_url"
   labels = {
     project_id = var.project_id
     host       = "api.spotify.com"
   }
 }
}
Here’s the created uptime check in the GCP console:

Figure 1
Next, I’ll need to configure Terraform to obtain an authorization header rather than using a hard-coded one. I’ve created two secrets using Secret Manager:
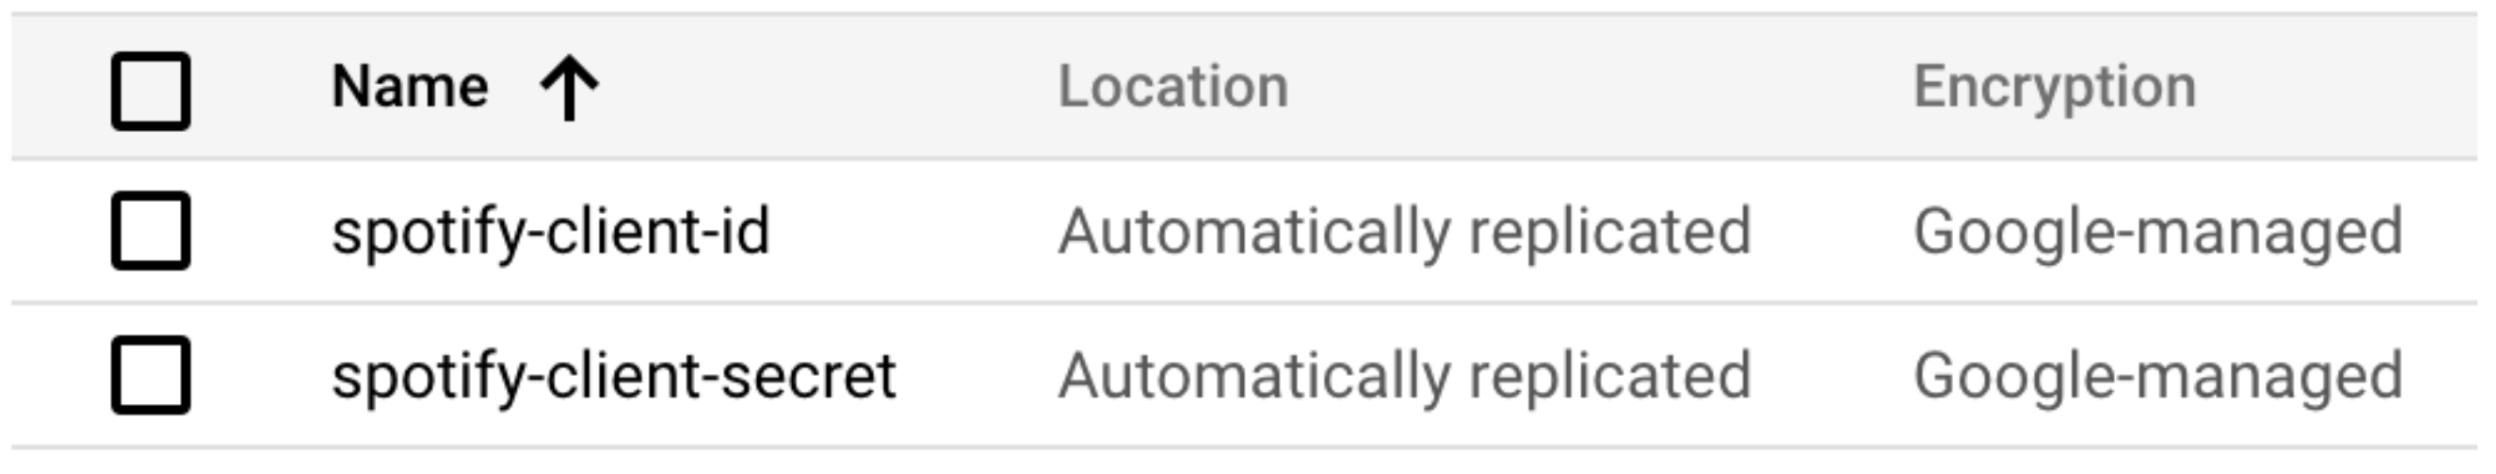
Figure 2
Terraform can retrieve those secrets and pass them to a script to obtain the authorization token:
data "google_secret_manager_secret_version" "client_id" {
 project = var.project_id
 secret  = "spotify-client-id"
 version = "1"
}

data "google_secret_manager_secret_version" "client_secret" {
 project = var.project_id
 secret  = "spotify-client-secret"
 version = "1"
}

data "external" "curl" {
 program = [
   "sh",
   "get-access-token.sh",
   data.google_secret_manager_secret_version.client_id.secret_data,
   data.google_secret_manager_secret_version.client_secret.secret_data
 ]
}
After applying those changes, the uptime check in the console is still running successfully. However, that authorization token will expire in an hour, so I’ll need to run Terraform every hour to keep updating it. To accomplish that, I’ll use the CI/CD tool Cloud Build to run Terraform and Cloud Scheduler to invoke that build on a cron schedule.
The Cloud Build job requires a service account with the following roles to be able to create authenticated uptime checks.
-
Logs Writer; to write build logs
-
Monitoring Uptime Check Configuration Editor; to create/modify uptime checks
-
Secret Manager Secret Accessor; to access the client id and secret
-
Secret Manager Viewer; to get the latest version of the secrets
-
Storage Object Admin; to read/modify Terraform state
Then only one step is needed to modify the uptime checks:
steps:
 - name: hashicorp/terraform
   args:
     - '-c'
     - |
       apk add curl jq
       terraform init
       terraform apply --auto-approve -var "project_id=$PROJECT_ID"
   entrypoint: sh
options:
 logging: CLOUD_LOGGING_ONLY
Finally, we’ll trigger this build to run every 55 minutes by setting the build to run in response to a webhook event, copying the webhook URL, and invoking it from Cloud Scheduler.
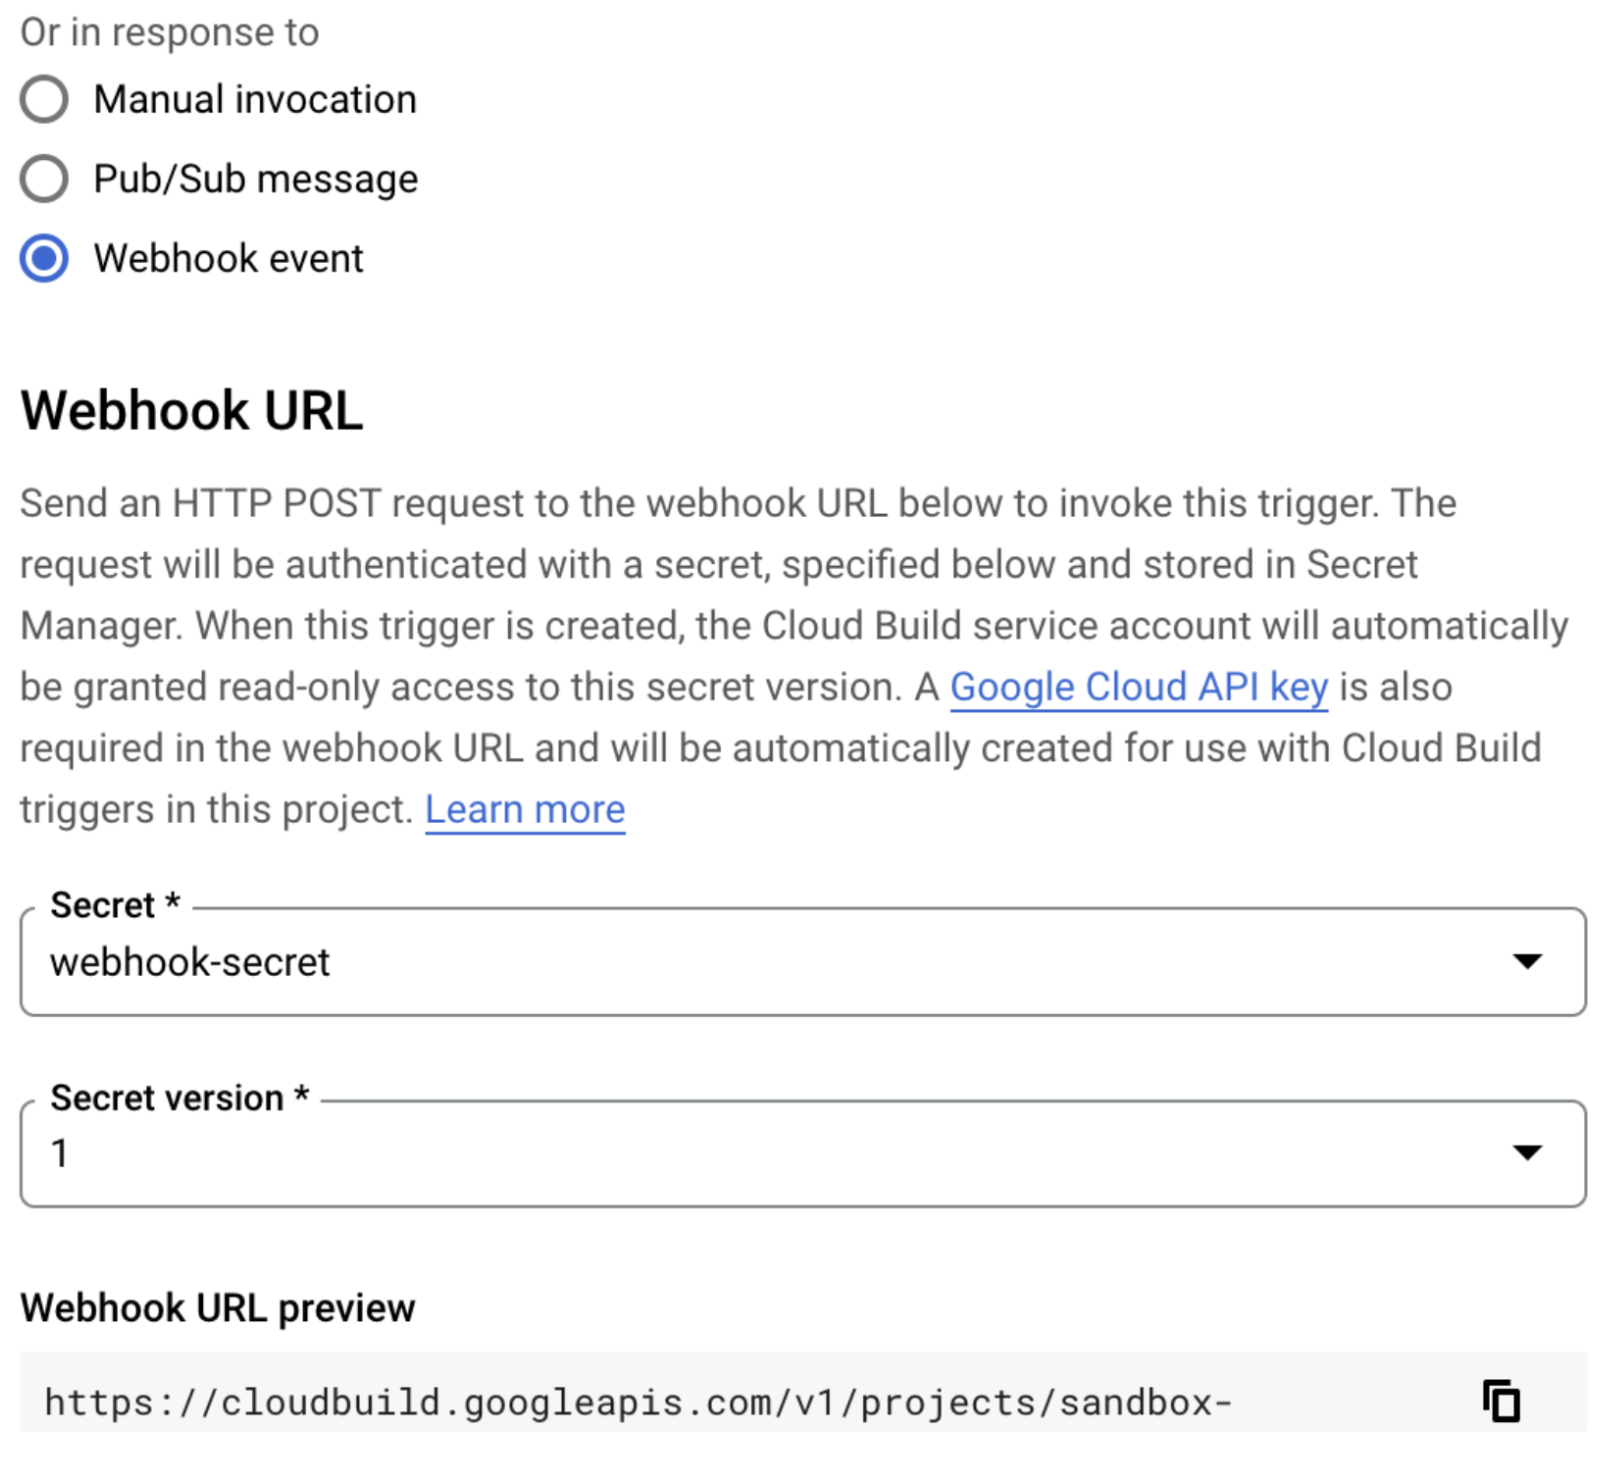
Figure 3
Note, when you create that trigger, ensure the body on your request is set to an empty JSON object, or the HTTP trigger will fail. Then, click “Run Now” on the Cloud Scheduler page to confirm it invokes your build successfully.
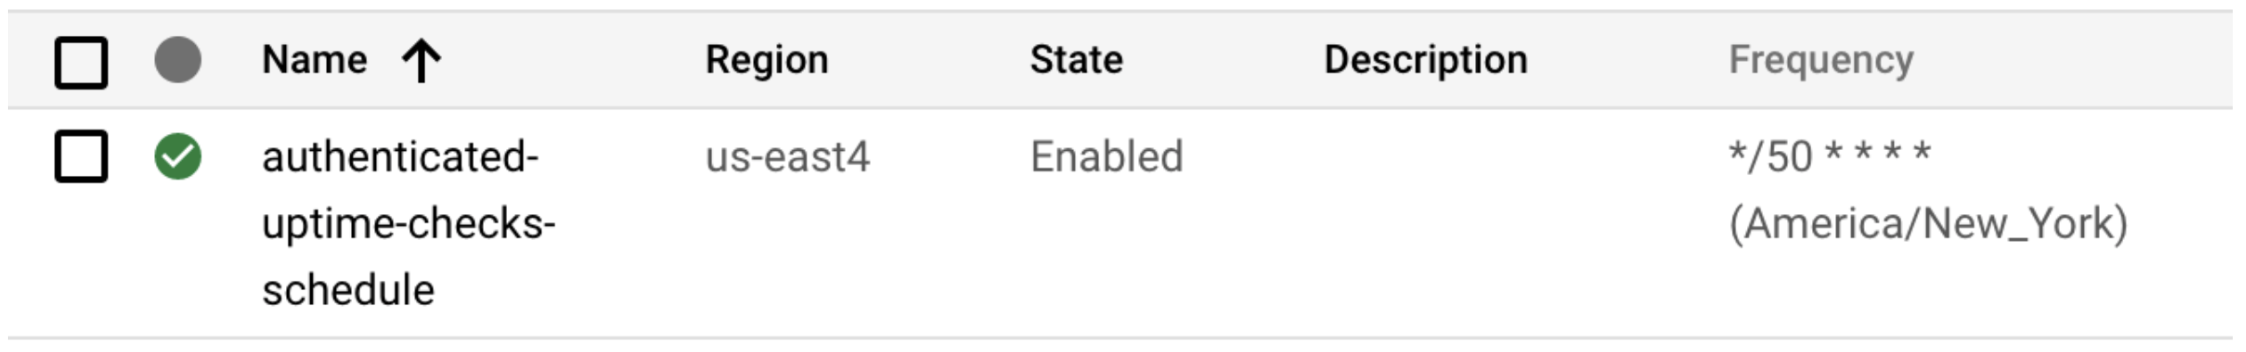
Figure 4
That’s it. Our uptime check will never lose access to the endpoint it’s monitoring.
Check out the repository with the code here: https://github.com/Nuvalence/authenticated-gcp-uptime-check
With the confidence of knowing that our uptime check will always be able to invoke our API and that the functionality under test is only the API itself, we can take full advantage of Uptime Checks.
Leveraging Uptime Check Data and Dashboards
Here’s a tour of that functionality on a check we’ve had running for about a month now.
At the top of the page, you can select a time range you want to look at, and there’s a high-level overview of the uptime and latency within that window. When potential consumers ask about the performance of your API, you have proof to back up that you have been meeting your SLAs.

Figure 5
To the right, you’ll see the current status of the uptime check in all regions. We’ve configured this test to only run from North America, but you could configure a global check and see the status in many regions. Then, when you do get an alert that your API is down, you’ll be able to identify impacted regions quickly.
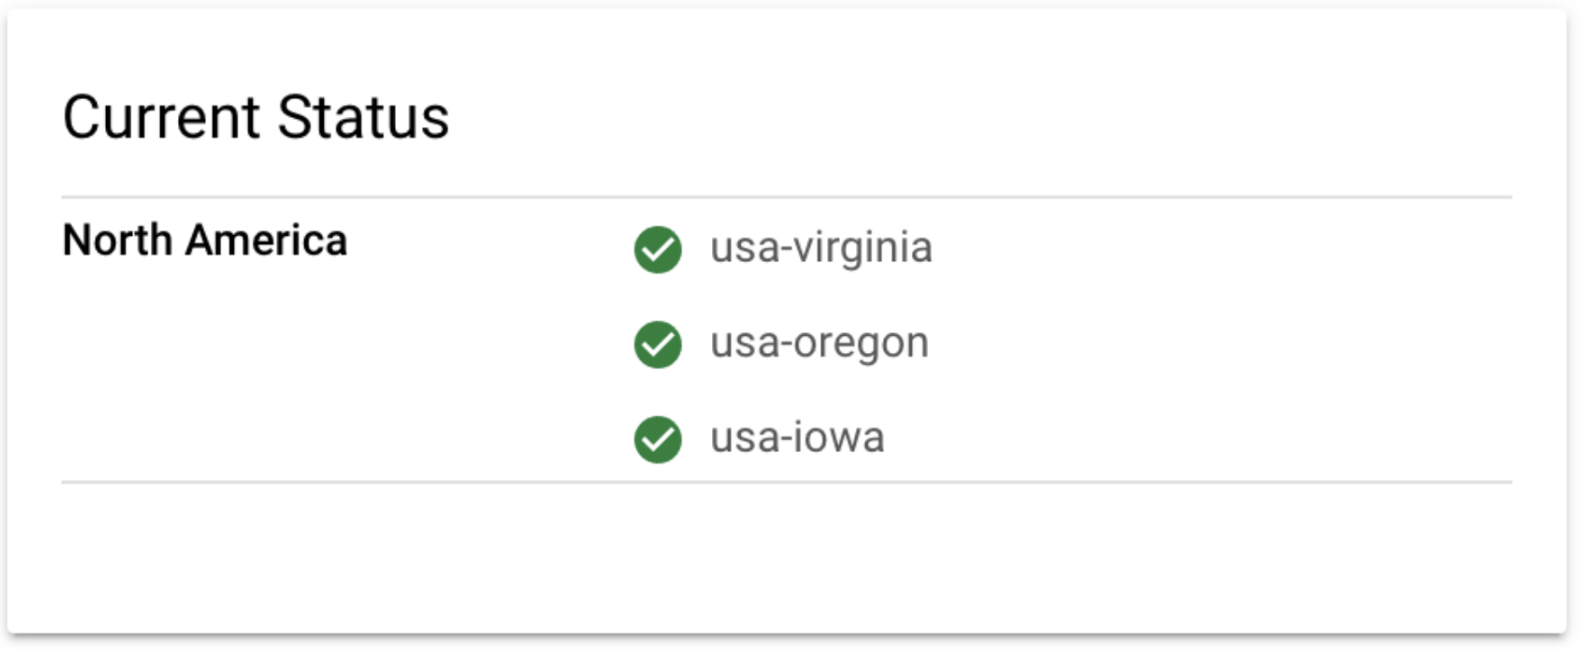
Figure 6
Next, there’s a graph of the uptime check status for each region over the selected period. This graph can help identify intermittent failures that didn’t necessarily trigger an alarm, but you can still investigate them to identify ways to improve your API quality.

Figure 7
Lastly, you’ll have a graph showing the API performance over the selected period. One common mistake we can make when measuring latency is measuring from the perspective of the service, obfuscating the fact that clients will experience a higher latency due to the network and that latency will differ based on the client’s location. For example, from our graph, the latency is much lower in us-west4 because that is where the service is hosted. Another benefit of this view of the data is that it can help you to identify trends – maybe your latency is slowly creeping up over time, and you might predict, if you continue on that trend, within a few weeks you’ll no longer be meeting your SLO.
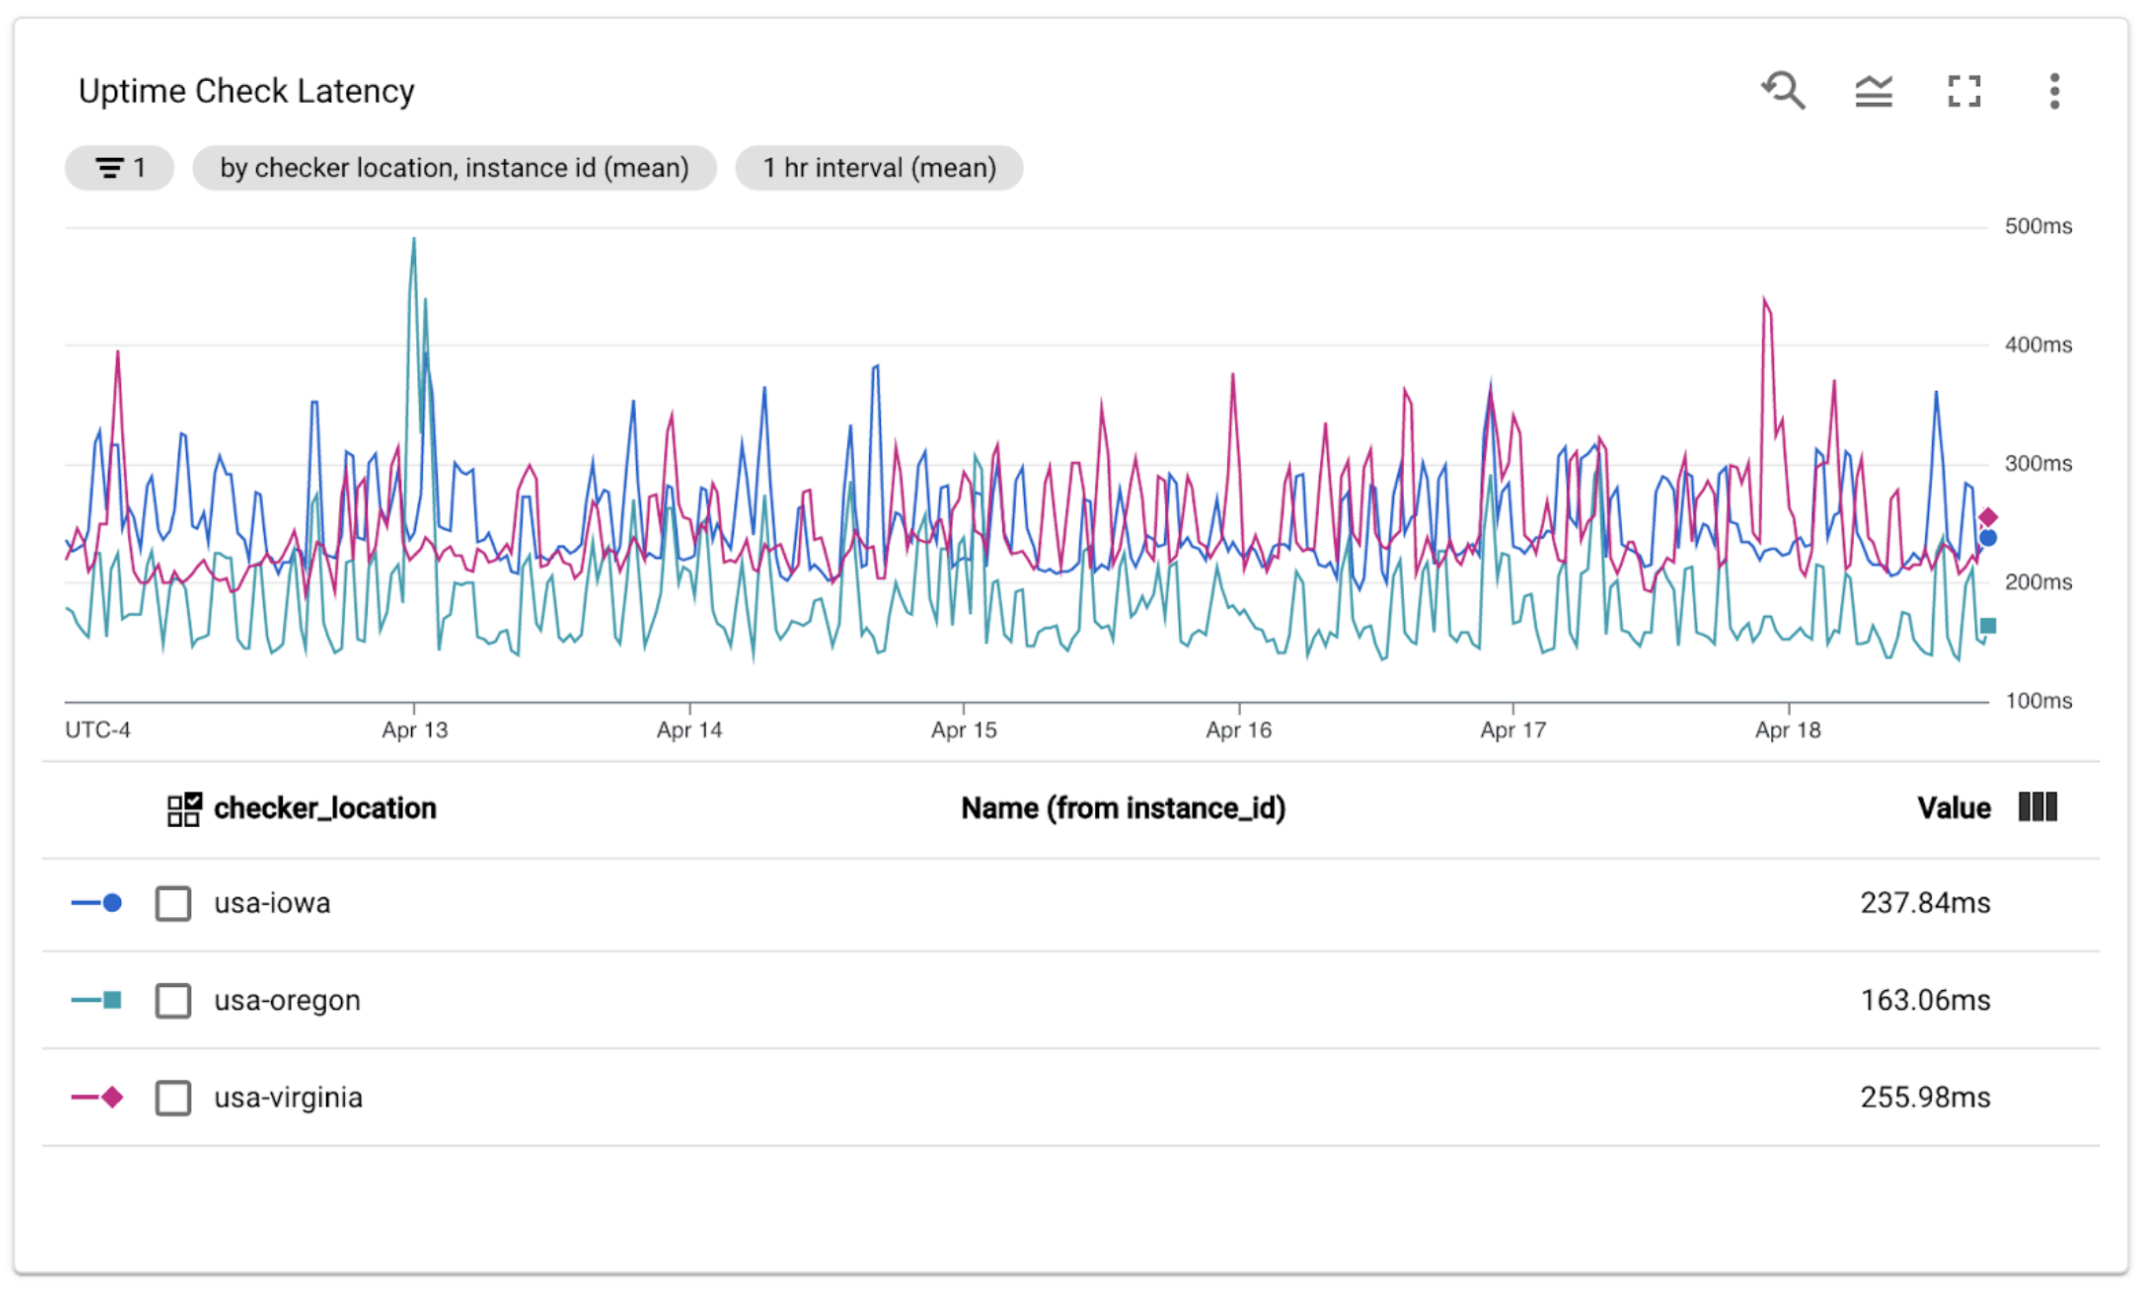
Figure 8
Synthetic monitoring is ultimately just sending fake traffic designed to monitor your API. While all of these metrics and graphs help you measure and improve your API’s uptime and performance over time, don’t forget to enhance the value by capturing API metrics and key performance indicators in the service. Metrics at the service level will also tell the story of the actual traffic from your users. You can use that data not only to make improvements to your API but also to identify which flows are most important to your users. On those critical paths, add synthetic monitoring to increase the probability of you finding out before your users when your API is behaving below your expectations.